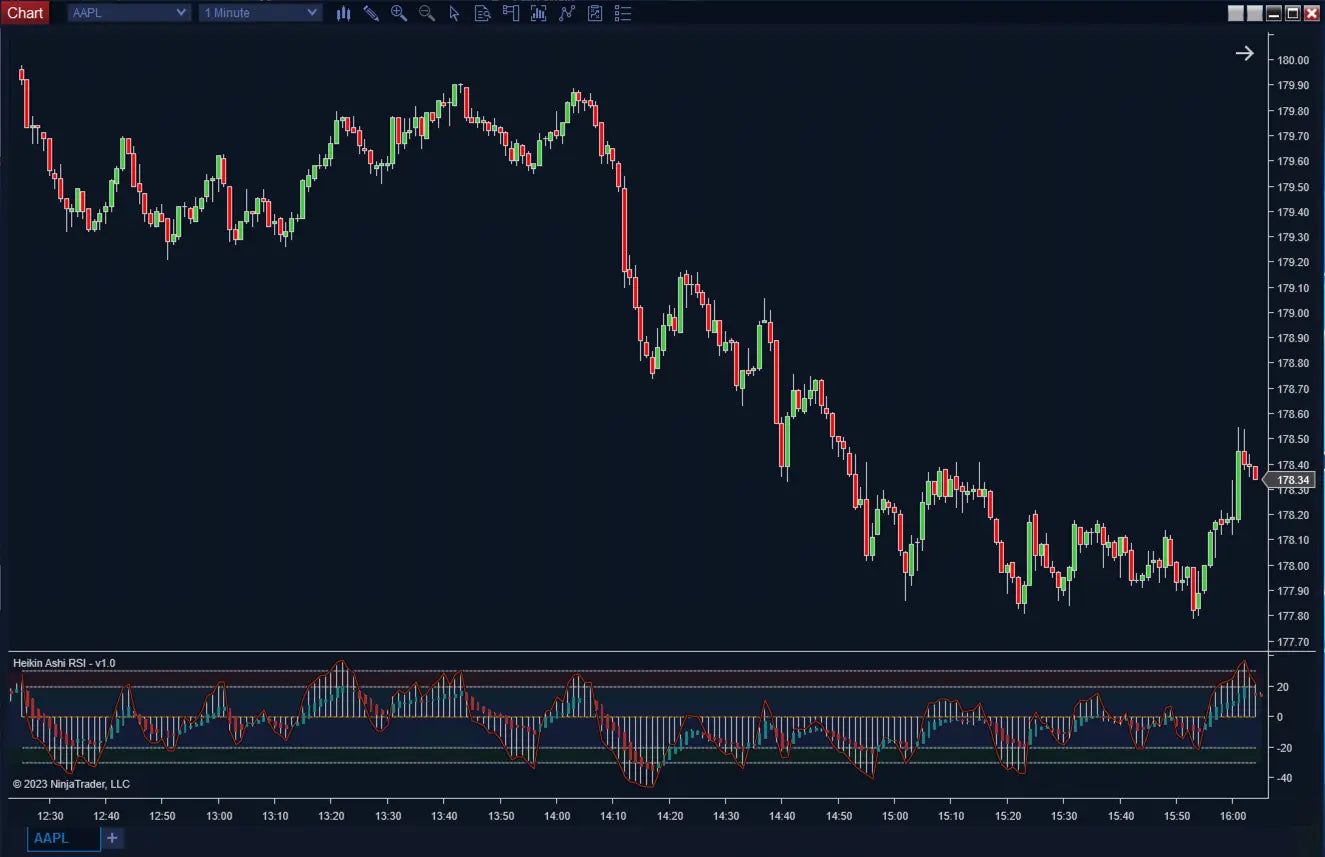
Heikin Ashi RSI
The Heikin Ashi RSI is a unique indicator that seamlessly integrates two powerful concepts into one comprehensive tool. It leverages the Relative Strength Index (RSI) to identify oversold and overbought conditions, while simultaneously deriving from the RSI values an oscillating pattern reminiscent of Heikin Ashi candles. This innovative approach effectively filters out the typical noise associated with conventional RSI indicators.This indicator offers a multitude of plots, empowering you to make well-informed decisions regarding potential entry points, exit strategies, and overall trend direction. Additionally, for those seeking to enhance the potency of the RSI, the indicator includes stochastic plot options, further expanding its analytical capabilities. Limitations: Calculation Restricted to Bar Close Only Limited to Time-Based Bars Visual Section of Properties Restricts Number of Heikin Ashi Bars to Plot (for improved performance)